Your plant stopped. Do you actually know why?
Hours of lost production, and the only explanation is a handwritten note saying “machine fault”. Your machines already know what happened. Run Rate reads the alarms your PLCs already raise and turns every stop into a named cause, how long it lasted and what it cost in output.
Shift 784 at Wandoo Fodder, a demo plant
7 h 02 m running, 58 m stopped, ≈ 100 logs not made
- Running
- Stopped
- Planned stop
- 1FAILED TO REACH PROX - FEED FORKSInfeed alarm, first out7 min≈ 16 logs
- 2SmokoPlanned, picked by the operator15 min
- 3Waiting for hayNo alarm. From the PLC's waiting-for-hay signal22 min≈ 51 logs
- 4STRAPPER 1 FAULTOperator's note: "strap jammed in the head"10 min≈ 23 logs
- 5STRAPPER 2 FAULTStrapper 2 alarm, first out4 min≈ 9 logs
Your HMI counts faults. Run Rate names them.
A fault count tells you something went wrong on the infeed. The message on the operator screen tells the fitter which prox to check. Run Rate keeps that message for every alarm, with when it came on, how long the line was down, and which alarm stopped it first, so a chain of follow-on alarms is only counted once.
What the screen shows at the end of the shift
Six faults on the infeed. Which ones, how long each one cost, and whether it's the same prox every night, the counter can't say.
What Run Rate shows for the same six
- FAILED TO REACH PROX - FEED FORKS3 times14 minStopped the line first every time
- FEED FORKS HIGH TORQUE TRIP2 times9 minBoth on night shift, within 20 minutes of each other
- VSD FAULT - CHAIN CONVEYOR 11 time3 minReset by the operator
Know what stopped you. Know what it cost.
The same live page on the crib-room screen, the manager's laptop and every phone. These are the real screens, running on the demo plant. Open the demo and click around; it runs live in your browser.
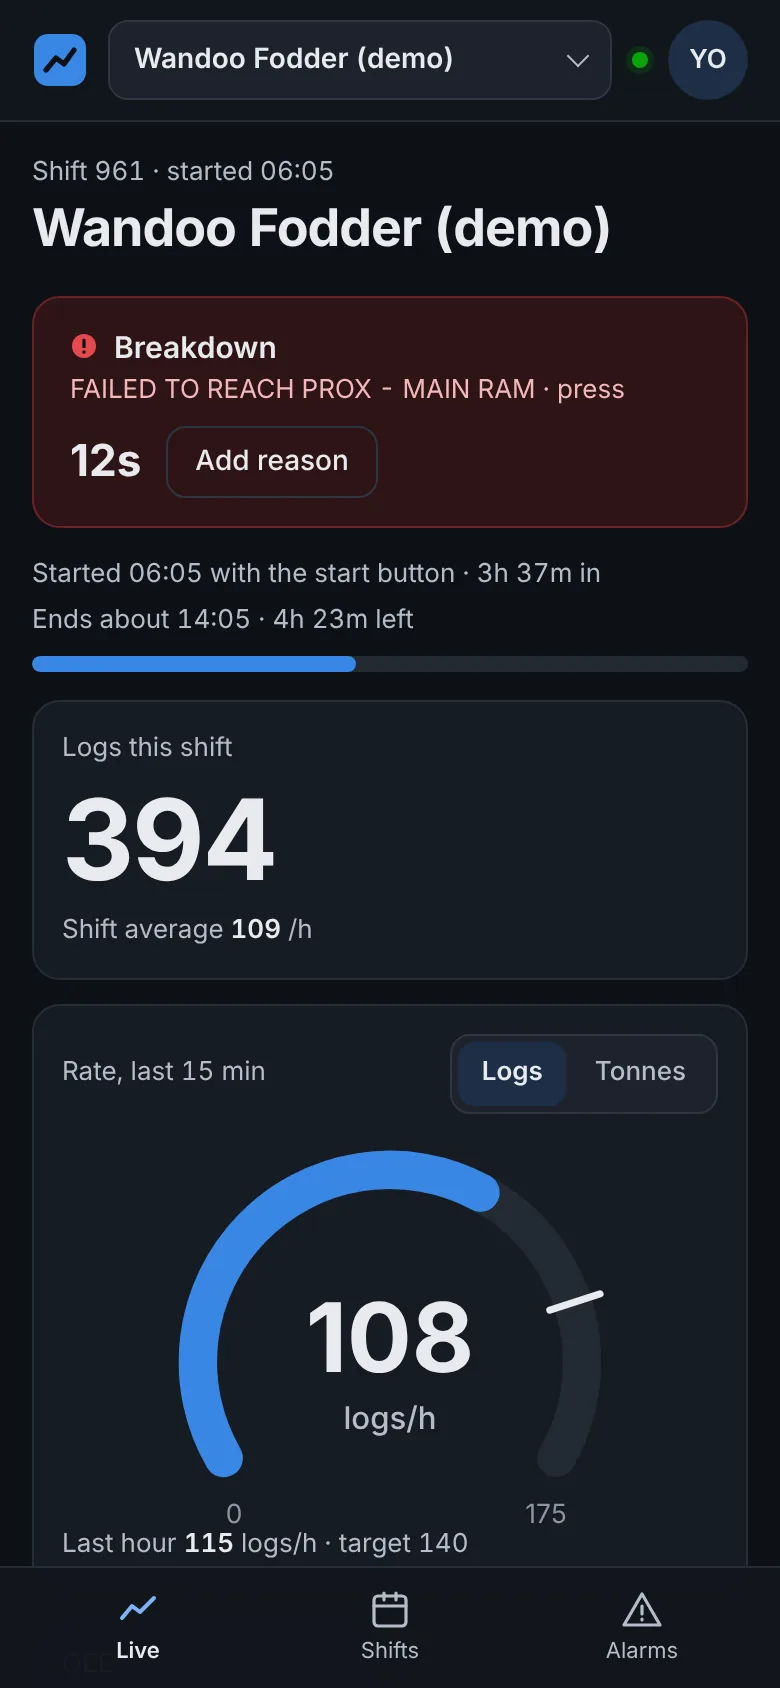
Live production, and why it stopped
Output, run rate and every section of the line as it happens: running, starved, blocked or stopped. When the line stops, the alarm that stopped it is on screen with a clock running, before anyone has picked up a radio.
Every stop is captured automatically, with what it cost in output at your target rate.

Find your biggest losses
Every alarm ranked by the downtime it caused when it was the first one in, and the logs that time would have made. A sensor fault that trips thirty times a week shows up for what it costs.
Every shift accounted for
Logs, tonnes and packs by day, this week against last. Open any shift to see its stops, alarms and where each section's time went.

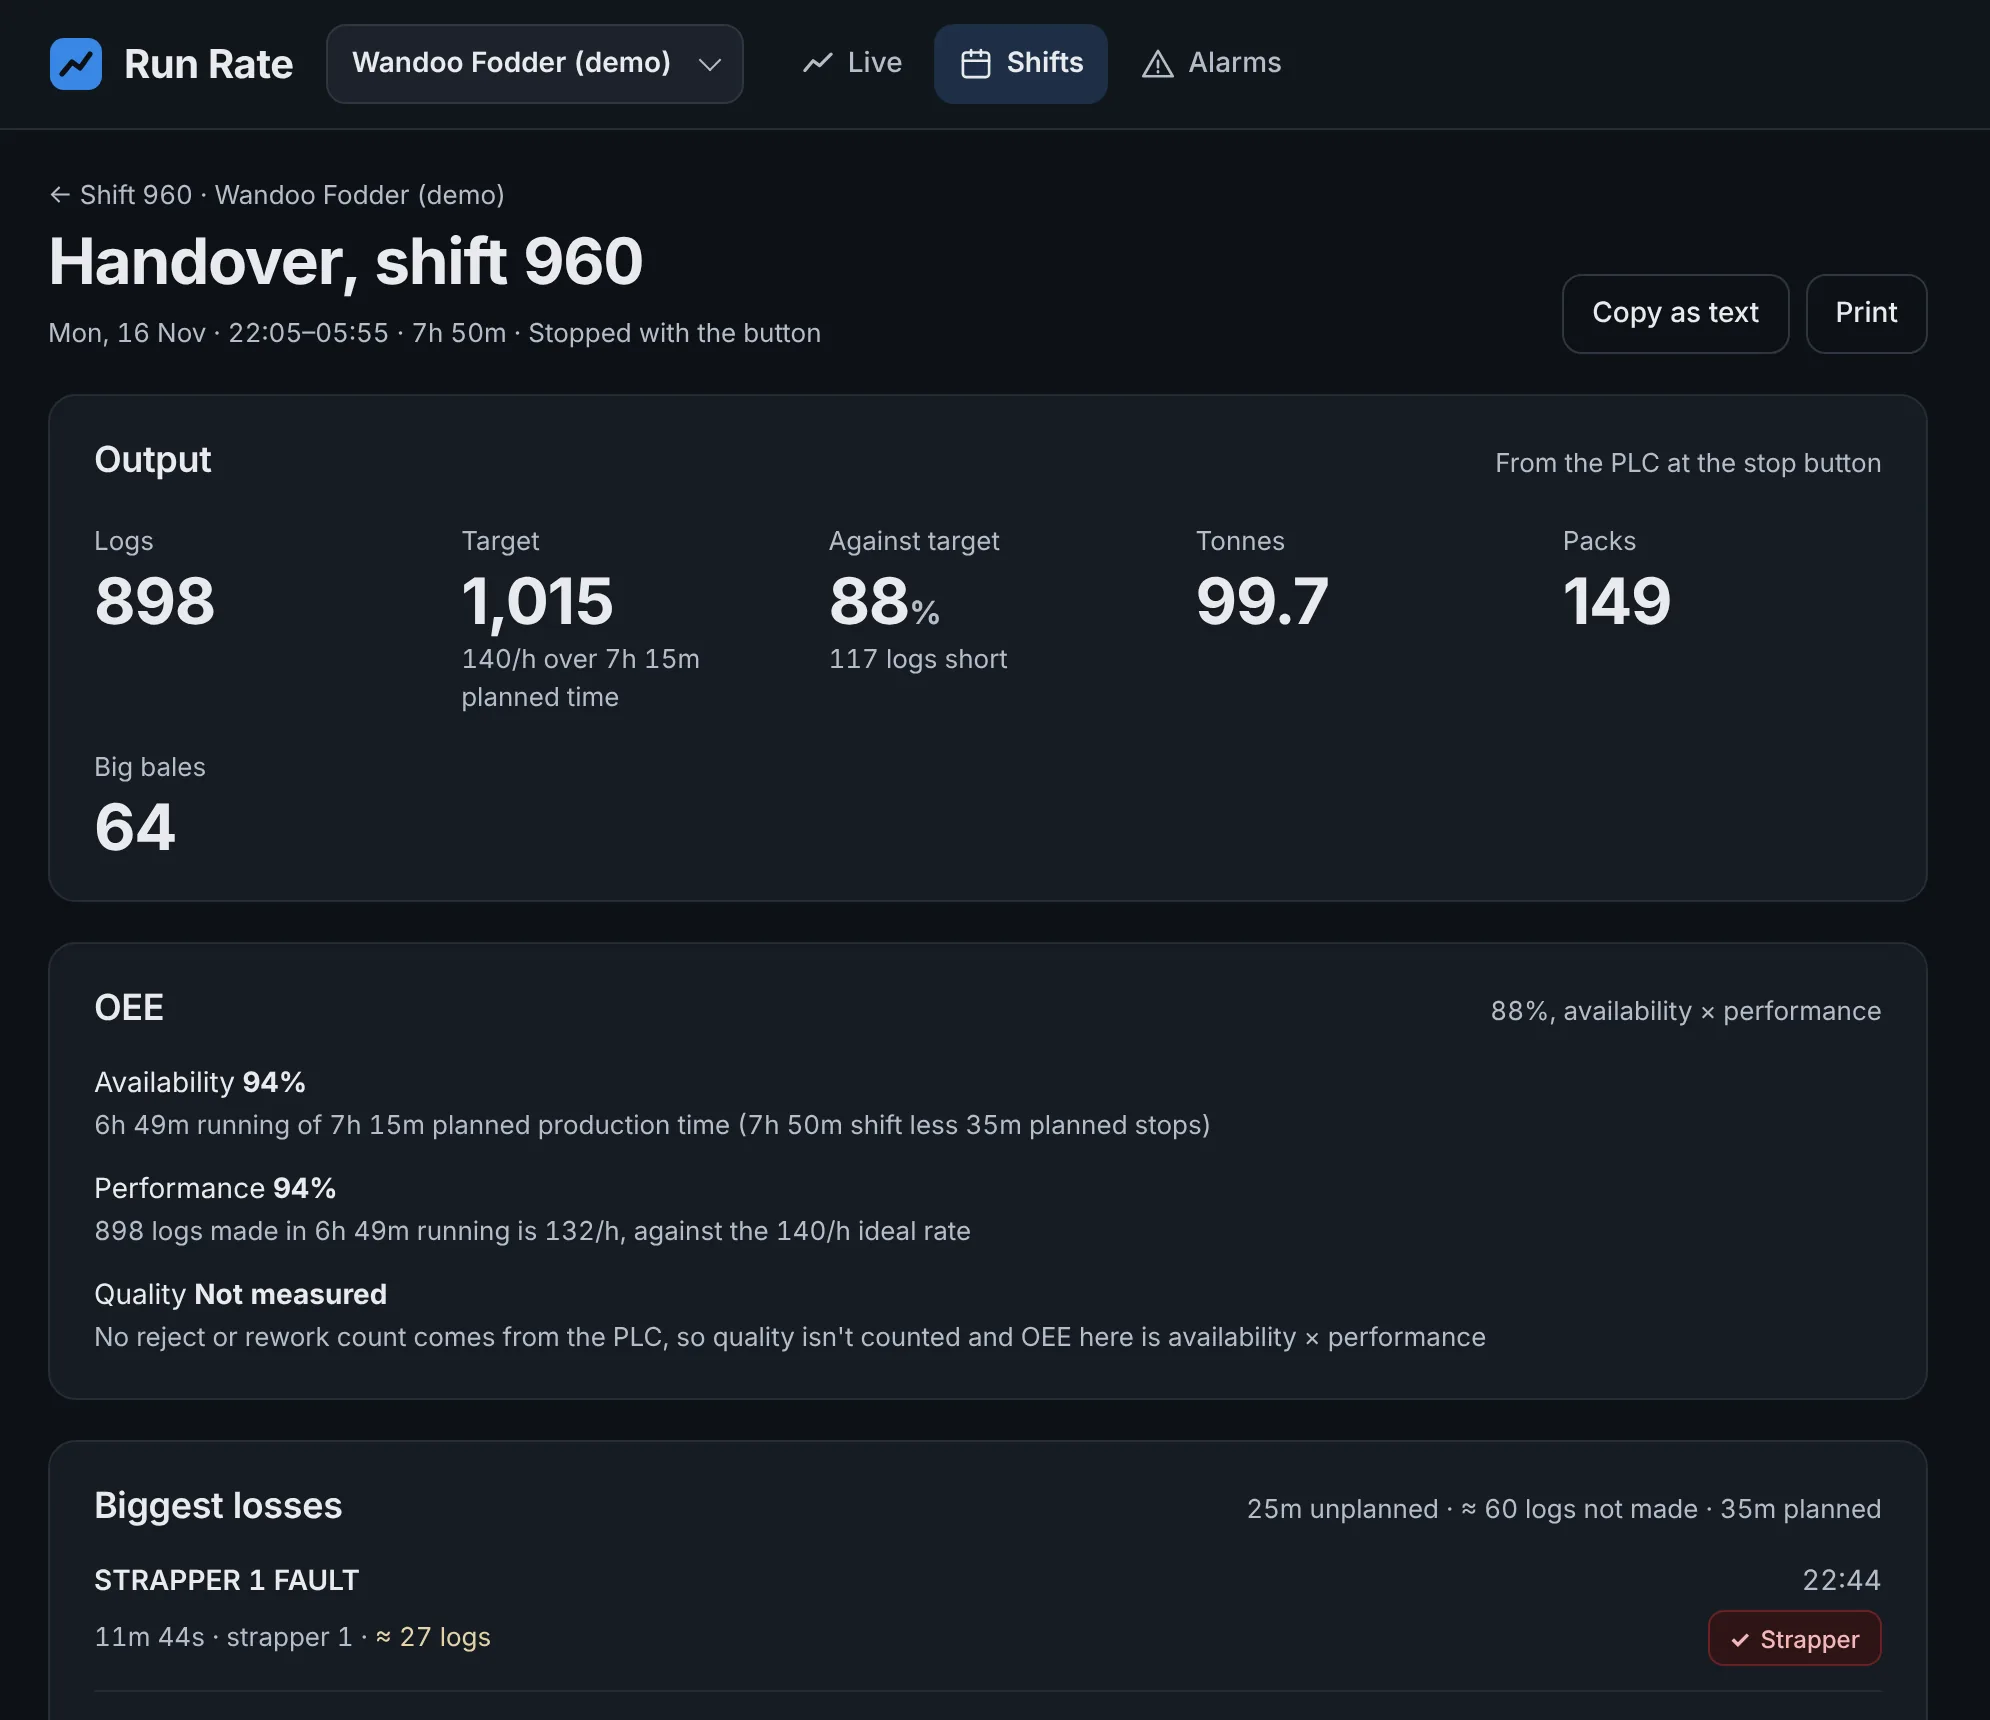
A handover report for every shift
What was made against target, OEE with how each part is worked out, the biggest losses, what's still open and the operators' comments. The supervisor adds the handover note, then prints it or pastes it into the group chat.
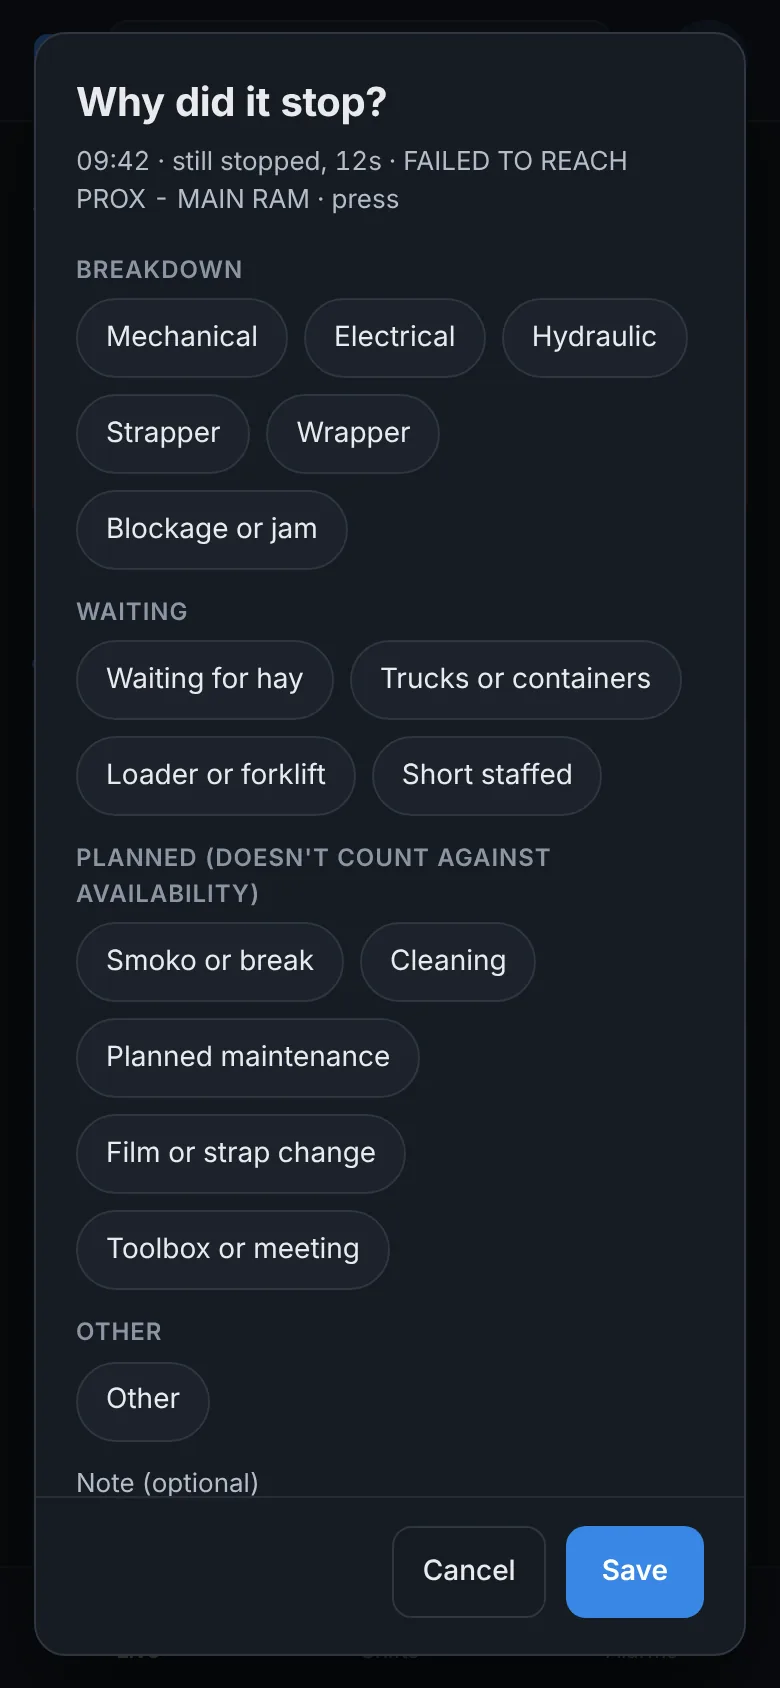
One clear picture, for everyone
Operators say why the line stopped in one tap. Maintenance confirms the cause. Supervisors write the handover. Management sees it all. Each person gets the role that fits, and planned stops like smoko don't count against availability.
No app store and nothing to install. Add it to the home screen and it opens like an app.
It reads what your PLCs already know.
No new sensors on the line and no changes to the programs running it. Run Rate picks up the alarm bits, auto bits and counters your controllers already hold.
-
Your PLCs
Keep running the programs they run today. Nothing is added to them and nothing is taken out.
-
A read-only gateway
A small PLC on your plant network reads alarm and status bits from each controller. Where a PLC already publishes MQTT, Run Rate listens to that instead.
-
A site PC
Sends each change to Run Rate. If the internet drops, it keeps everything on disk and catches up when the link is back.
-
Run Rate
Your data is stored in Sydney. Open it in any browser, or add it to a phone's home screen like an app.
Nothing in this path writes to a PLC. The gateway only reads, and the line doesn't depend on Run Rate to run. Running today on AutomationDirect BRX and Do-more controllers. If your PLCs can serve Modbus TCP or publish MQTT, they can feed Run Rate the same way.
Questions
Do you change our PLC programs?
No. Run Rate reads data your PLCs already hold. The gateway has no write instructions in it, and nothing is ever sent back to your controllers.
We don't have access to our PLC programs. Can we still use it?
Whoever looks after your PLCs will need to tell us which addresses hold the alarms, auto bits and counters, or let us read a copy of the program. Their program stays exactly as it is.
What happens when the internet goes down?
The site PC keeps every change on disk and sends it in order once the connection is back, so the shift record stays complete. The plant runs the same either way.
Where is our data kept?
In a database in Sydney, Australia. Each plant's data is only visible to the people signed in to your organisation.
Who can change what?
Each person has a role on each site. Operators give stop reasons, maintenance confirms causes, supervisors write the shift handover and add people, and viewers only look. The database enforces it, not just the screen.
What do operators need?
A phone, a tablet or the PC in the crib room. Run Rate runs in the browser and can be added to the home screen. There's nothing to install.
What does it cost?
It depends on how many sites and lines you run. Book a demo and we'll quote for your plant.
See it on your line.
Tell us about your plant and we'll be in touch to set up a demo. If you know which PLCs you run, that helps us show you how it would connect.